Most of the volume isn't real
Of everything traded on tokens launched that day, 91.8% is wallets buying from themselves.
This started by eye, not by query. Scrolling PONS on a trading terminal, essentially every token looked the same — the identical stair-step climb, the identical collapse. Not some of them. Nearly all of them. So we went and measured it, and what came back was worse than the impression.
Anyone can launch and trade a token on PONS without permission, and platforms built that way always attract this kind of thing. That is not unusual in itself, and nothing here is an accusation against PONS.
But it is unusually concentrated. And whoever runs it is paying to do so — somewhere around $74,000 to $108,000 a day. What makes that awkward is where the money lands: roughly 59 cents of every dollar they spend is collected by PONS.
So PONS is supported twice over — by the volume figure this produces, and by the cost of producing it.That proves nothing on its own, and it is worth repeating that no link was found between PONS and any of these operators. So assume the innocent reading: they have no idea this is happening. The numbers are still staggering — because almost none of the volume the platform reports is real.
Three hours, three days, every single launch checked
Not a sample. A monitor watched the launch factory for sixty minutes, waited for each token's activity to finish, and measured every launch. Then it was repeated on two more days, at different times.
Across all three hours, real trading accounted for under nine cents in every dollar. Measured separately they came out at 91.9%, 90.8%, 92.6% — a 1.8-point spread across three independent measurements on three different days.
Everything else moves. The machine doesn't.
This is the part that is hard to explain innocently. The number of tokens launched swings enormously hour to hour with whatever the market is doing. The number of wash campaigns inside those hours barely moves at all.
Organic activity responds to conditions — quiet hours produce fewer tokens, busy hours produce more. A process that keeps producing 51–53 campaigns an hour while everything around it falls by 68% is not responding to anything. It is running to a fixed quota. That also means the wash operators and whoever mass-produces the empty tokens are not the same people — only one of them reacts to the market.
Hour by hour, it does not change
Each hour below is a full census — every launch in the window measured, waited on until its activity finished, then scored. They were taken at different times, on different days, independently of each other.
The first complete census. Every launch in the window scored, not a sample — establishing the baseline that roughly nine in ten dollars traded were manufactured.
Measured 22 hours later. Total launches fell 59%, yet wash campaigns moved by one (52 → 51) and the fake share by 1.1 points. The machine is indifferent to how busy the platform is.
A different time of day, six hours later again. Launches fell another 21%, campaigns rose by two, and the fake share moved 1.8 points. Three separate days, three separate slots, same answer.
This is the point of repeating it. A single hour could be a fluke — a busy spell, a one-off operator. But the volume of real trading stays near one dollar in ten whenever you look, and the count of wash campaigns barely moves even when everything else on the platform does. It is not an event that happened; it is a process that runs.
The volume chart, with the manufactured part taken out
Both panels are the same days on the same scale. Left is the platform's daily volume as reported. Right is the same days with the portion shown to be manufactured removed.
Note the label: “not shown to be manufactured”, not “real”. The 91.8% figure was measured on tokens launched inside the measured hour. It is applied here only to that same fresh cohort — never to the whole platform. See below for why that distinction matters.
Volume is reconstructed from the fees each pool actually paid out — the launchpad takes exactly 1% of every trade, so the fees leaving its locker contract reveal the volume that produced them. That is a whole-platform measure and needs no third-party dashboard; anyone can re-derive it. The split applies the 91.8% manufactured share measured in the hourly censuses above.
Show the numbers
| Day | Reported | Shown manufactured | Remainder |
|---|---|---|---|
| 31 Jul | $48,794,643 | $35,122,203 | $13,672,440 |
| 1 Aug | $39,906,440 | $26,222,255 | $13,684,185 |
| 2 Aug | $44,418,366 | $27,160,768 | $17,257,598 |
| 3 Aug | $28,334,107 | $19,854,260 | $8,479,847 |
| 4 Aug | $46,830,390 | $30,581,625 | $16,248,765 |
| 5 Aug | $36,266,829 | $25,622,539 | $10,644,290 |
Where the daily figure comes from, and what it doesn't claim
A fair criticism of any “X% is fake” number is that it gets stretched further than the measurement supports. So here is exactly how far this one goes.
The 91.8% was measured on tokens launched inside the measured hour. Established tokens are a different population — several launchpad tokens keep trading for days and do millions in genuine volume. Applying the wash share to them would be wrong, so it isn't applied to them.
The other third is genuine market activity in tokens that survived. These launchpad tokens each did seven figures over the measured week:
| Token | Volume, measured week |
|---|---|
| TYGR | $3,642,367 |
| NASDANQ | $2,385,557 |
| BRODIE | $2,256,186 |
| YOLO | $2,105,396 |
| DCR | $1,880,652 |
| TENT | $1,876,693 |
This is not a claim that a platform reporting $40M is really doing $3M. Real tokens with real markets exist on PONS and trade every day. The claim is narrower and still large: the newly-launched cohort is overwhelmingly manufactured, and that cohort is most of the platform's daily volume. Anything deployed outside the launchpad — including a platform token with its own pool — is not in these figures at all, because they are derived from the launchpad's own fee payouts.
Of the tokens that actually traded, most are the campaign
Plenty of tokens launch and never go anywhere. That is completely normal on any permissionless launchpad and it is not what this is about — in the busiest measured hour, 170 of 236 tokens got essentially no trading at all, and that is unremarkable.
The finding is about the ones that did get activity. Set the dead ones aside and look only at tokens that saw meaningful trading:
66 tokens saw real trading activity that hour. 52 of them — 79% — were wash campaigns. Between them they carried 91.9% of everything traded.
Dead tokens cost nobody anything and mislead nobody. Manufactured ones produce the number the platform is measured on. Those are different problems, and only the second one is this.
What one of these looks like
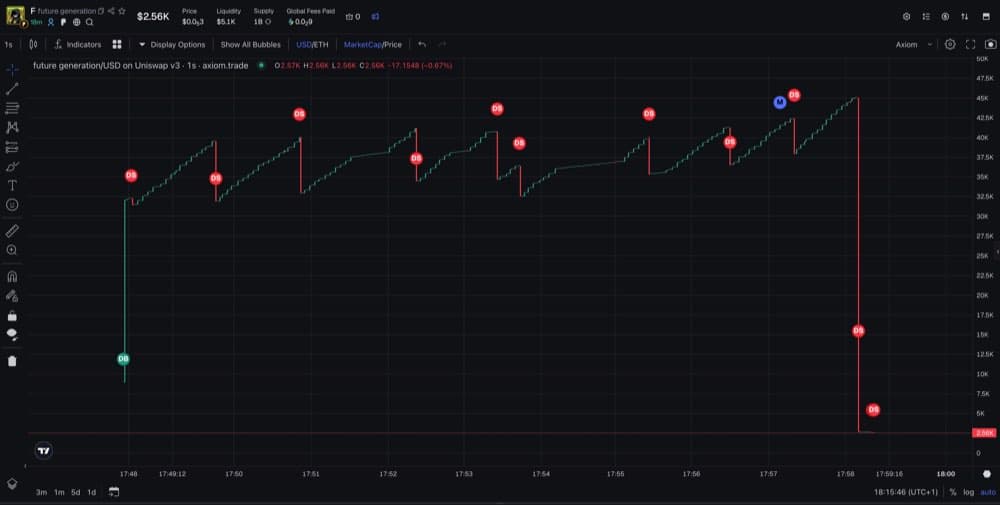
- Someone launches a token and buys ~3.5 ETH of it themselves in the same transaction.
- They send small amounts of ETH to around 200 fresh wallets they control.
- Those wallets buy from each other for seven to sixteen minutes, walking the price up. This is the volume.
- The creator sells, the price returns to where it started, and the next token launches.
97.7%–99.4% of the buying comes from wallets the launcher funded itself. Genuine outside participation is under 2.5%.
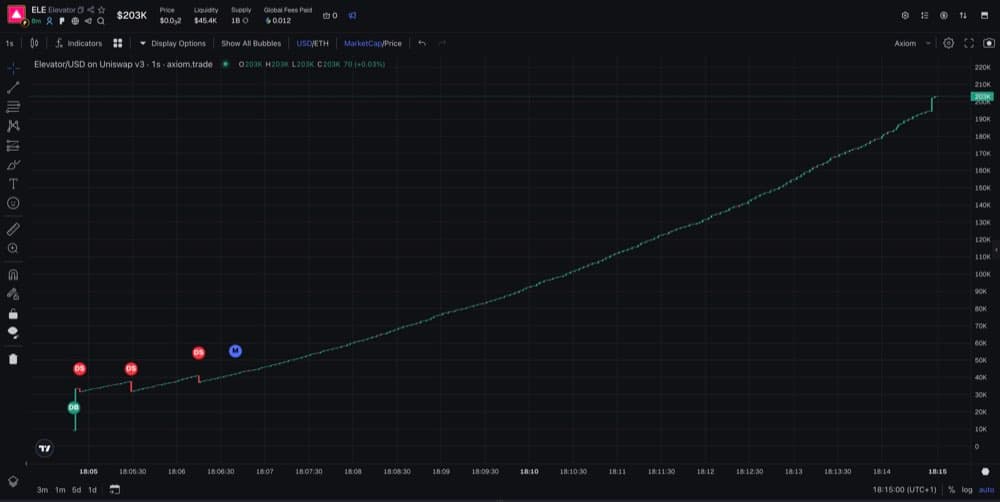
This is a live terminal feed. All of it is the same operation.
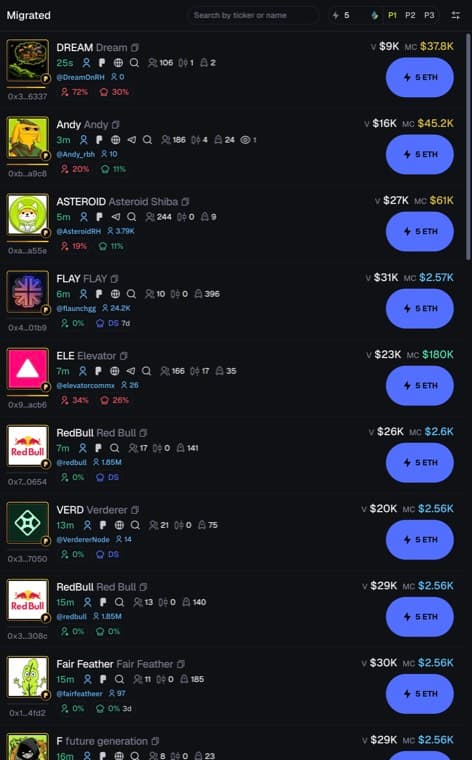
That is not a curated screenshot. It is simply what the feed showed at that moment — and it is what it shows most of the time.
Open any trading terminal, go to the migrated tab or anything climbing toward it, and pick a PONS token at random. Look for the vertical dev buy at the open, an unnaturally smooth staircase up over roughly ten minutes, then a single vertical drop back to the floor.
The shape, three more times
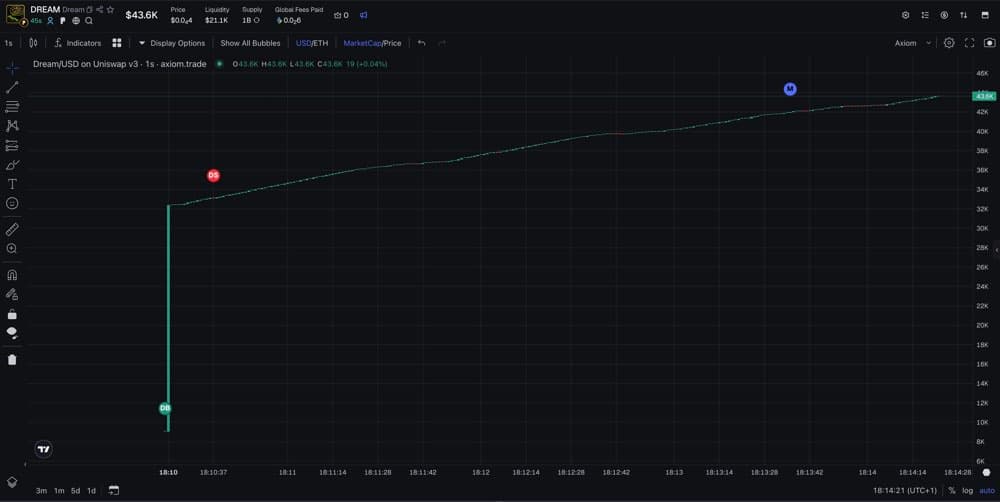
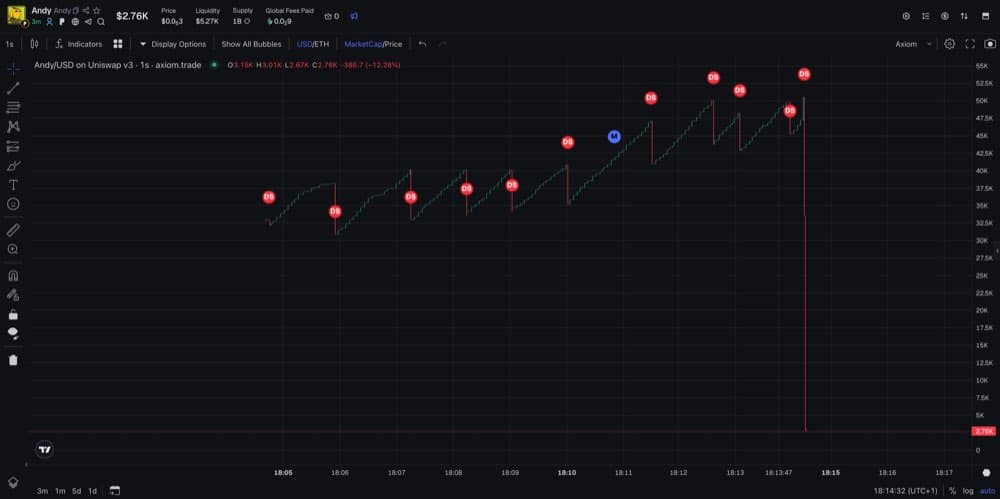
A vertical dev buy, then an unnaturally smooth staircase upward on hundreds of tiny buys, then the seller returns it to the floor. Three separate tokens by different wallets.
It costs almost nothing
Gold is the volume each token printed. Red is what it cost to print. The red is there — it's just too small to see.
Every $1 spent produces $282 of reported volume. Running all 52 campaigns for a whole hour cost roughly $5,030 in total.
The reason it's this cheap: PONS charges 1% per trade, but lets the token's creator collect that token's trading fees — and the contract pays them 70% of it back. Nothing distinguishes real volume from volume the creator makes against itself. So the true cost is 0.30%, not 1%.
Verified against real payouts, not just contract source. Of that daily revenue, $60,387 traces to the manufactured activity. Note the effective rate is ~0.15% of gross volume, not 0.3% — the 1% fee is taken from the input token, so only the buy side pays PONS in anything spendable.
These are configuration values, not decisions
The launches aren't merely similar — they're parameterised. Opening buys land on a handful of repeated values, and every campaign has the same shape.
| Opening buy | Times used | Campaign shape | Observed range |
|---|---|---|---|
| 3.50 Ξ | ×27 | wallets per launch | 196 – 206 |
| 3.88 Ξ | ×24 | swaps per launch | 1,600 – 3,800 |
| 3.60 Ξ | ×16 | duration | 7 – 16 min |
| 3.85 Ξ | ×11 | median gap between buys | 0 sec |
| 3.80 Ξ | ×10 | gap between campaigns | 204 sec median |
Nobody picks 3.88 Ξ twenty-four separate times by hand. Discrete repeated values across hundreds of launches are a config file being read by a program. Across the 156 campaigns measured, the opening buy has a standard deviation of 0.198 Ξ.
It isn't laundering. That matters.
The obvious objection to all of this is that somebody is losing $80,000 a day, so it must be worth it to them — and the usual reason to accept a loss on wash trading is to move money. Taking a haircut to clean funds is an ordinary, well-documented thing.
This isn't that, and the shape of it says so.
Why the laundering explanation doesn't fit
- The money doesn't go anywhere. It leaves the operator's wallets, goes round a pool, and returns to the same operator's wallets. Cleaning funds requires them to end up somewhere else. Here the start and the finish are the same addresses.
- Nothing is obscured. Every hop is a public Uniswap swap between wallets that one address funded. This adds a trail rather than breaking one.
- The amounts never vary. Laundering is sized to whatever needs cleaning. This opens at 3.50 Ξ over and over — 27 times out of one 4-hour sample — regardless of anything happening around it.
- It never stops or surges. Platform activity fell by 68% between two of our measured hours and the campaign count moved from 52 to 51. A cleaning operation responds to inflows. A cron job doesn't.
- The volumes are far too small. ~$25,000 per campaign, round-tripped back to source. Nobody builds a 200-wallet fleet and runs it a thousand times a day to move sums that size in a circle.
So the loss is real and it is being paid deliberately, but not to move money and not to make it. Strip out both of those and what remains is a script whose only reliable output is a volume number — and a fee stream, most of which goes to the platform being measured.
Where the operators' money actually goes
The cost of a campaign isn't burned — it is paid to someone. Broken down per audited campaign, most of it has one destination.
Measured across four audited campaigns the share reaching PONS ranged 52%–68%. At 1,230 campaigns a day that is $73,800–$108,240 of daily outlay, of which $60,387 was measured arriving at the PONS fee wallet.
PONS benefits from this in both directions at once. The activity manufactures the volume figure the platform is ranked on, and the cost of manufacturing it is largely paid to PONS. An operator burning money on this is, in effect, buying the platform a headline and paying it a fee for the privilege. That does not demonstrate PONS is involved — but it is why the question keeps coming up.
A note on v1 and v2
Everything measured here is PONS v1, which pools each launch straight into a Uniswap v3 position. PONS also has a v2 stack that prices launches against tokenised stocks and pools on Uniswap v4. We checked it for the same signature.
It isn't running on v2, and that is unsurprising rather than significant. v1's structure is what makes the operation cheap — the whole supply goes into a single v3 position at a 1% fee, and the launcher can point that fee back at itself. v2 works differently. An operator optimising for cost would stay on v1.
The timing is a coincidence worth defusing: v2's launch gate opened very recently, while this activity has been running for days beforehand. The two happening close together doesn't connect them. And it changes nothing about the headline figures — volume trackers count the platform as a whole, and the platform's volume is overwhelmingly v1.
Why this points somewhere, even assuming innocence
Nobody is making money trading here. There are no real buyers to take money from, and the whole token supply is locked into the pool at launch, so the creator can only sell what it bought. Each campaign is a cost, willingly paid, roughly $80 a time, over a thousand times a day — and it has been running like that for days on end.
People don't spend money for nothing. They're buying something — and the only thing these tokens reliably produce is a volume number.
Roughly two thirds of a headline volume figure is manufactured — about $20M of a $30M day. The remaining third is not claimed to be clean; it simply hasn't been shown to be manufactured, and some of it is demonstrably genuine trading in established tokens.
What this does not show
- No link was found between PONS and any operator. It was searched for. The fee wallet has no funding relationship with any of them.
- The operators keep separate wallets and separate funding — that looks like several independent parties, not one coordinated entity.
- Someone farming an expected airdrop would behave in exactly this way, and that explanation fits every number on this page.
- So the fair statement is narrow: PONS built a fee rebate that makes manufacturing volume nearly free, and earns 30% of the result. Who is pressing the button is unknown.